Since 1995, the White House has been required to deliver an annual report to Congress listing the name, salary, and position of every person working in the Executive Office of the President (hereafter referred to as EOP). These reports are accessible to the general public and include around 500 employees. Inclusive America has been working to analyze these reports from the past 20 years and collect demographic data on gender identity and race/ethnicity for the thousands of White House employees and political appointees. By examining different reports over time, we can identify patterns that may indicate inequities in hiring and salary practices and determine if progress has been made.
The following charts illustrate the representation of various groups within the EOP over the past 20 years. The first figure tracks the hiring trends of women, people of color, and women of color. Subsequent figures highlight the pay disparities affecting these marginalized groups over time. We will conclude by discussing the urgent need for systemic change to ensure that the EOP reflects the diversity of the populations it serves, regardless of the administration in power.
Key Findings
- The EOP was most diverse during the Biden Administration, surpassing the diversity levels of the Obama Administration.
- Diversity in hiring is significantly influenced by the administration, with Democratic administrations consistently hiring more diverse staff than their Republican counterparts.
- Despite improvements in representation over the past few years, persistent pay disparities remain for women and people of color, indicating that increased diversity has not yet resulted in equal pay.
Democratic Presidencies See Progress in Hiring Equity, While Republican Presidencies Experience Declines
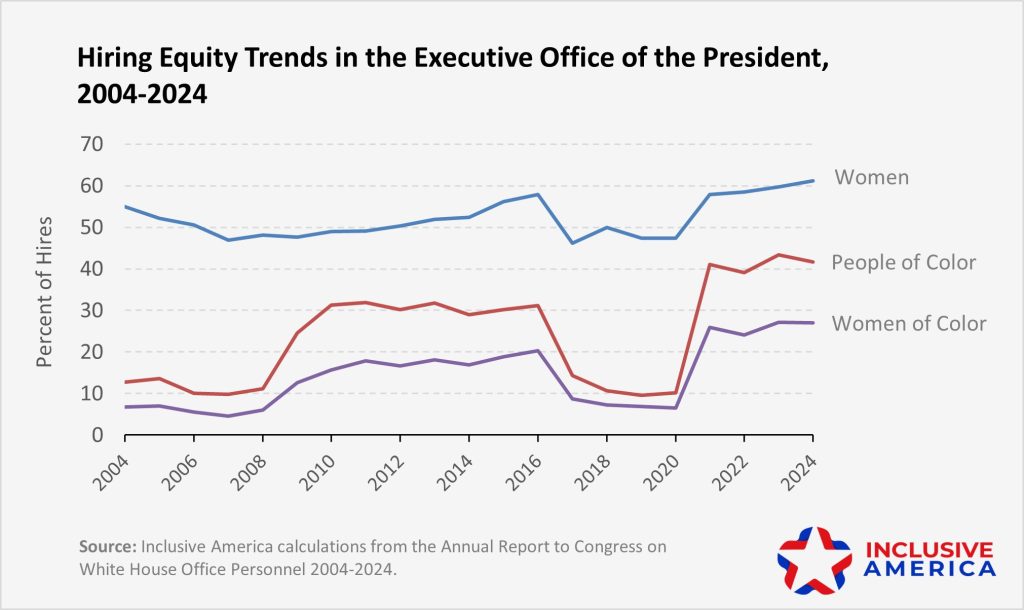
In recent years, hiring equity has shown significant progress under the Biden administration, surpassing the diversity levels of the Obama Administration. By 2024, women constituted over 60 percent of all EOP employees and political appointees, achieving gender parity with their representation in the U.S. population at approximately 51 percent. Notably, the Biden Administration also reached a 20-year high in hiring rates for people of color and women of color, with 41.27 percent of the EOP identifying as people of color and 26 percent identifying as women of color on average throughout the administration.
In contrast, hiring equity has declined under Republican administrations. The Trump administration observed the lowest percentage of women hired in two decades during its first year, 2017, and saw hiring rates for people of color drop below 15% throughout all four years. On average, the Trump administration hired and appointed fewer women and people of color compared to the previous Republican administration, the Bush administration. This trend suggests that while Democratic administrations are making strides in hiring diversity, Republican administrations may be regressing in their efforts to hire diverse staff and political appointees.
Women of Color Face the Largest Disparities in EOP, with Inconsistent Progress Toward Equity
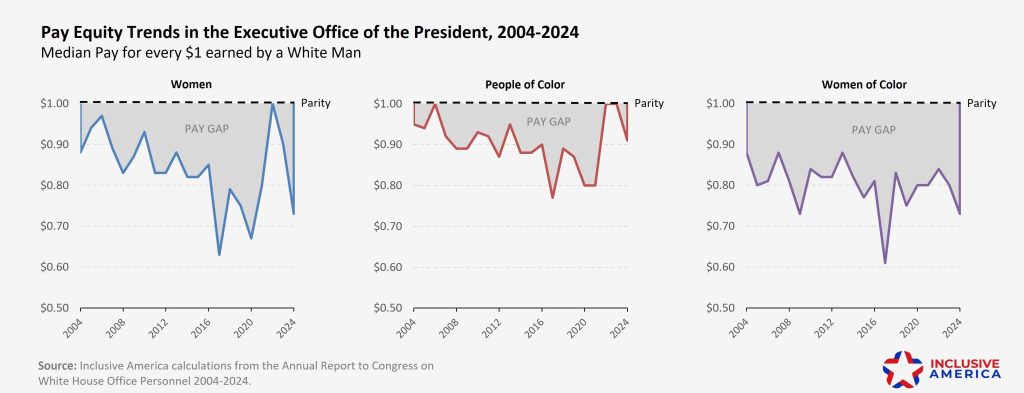
Pay gaps have remained a persistent issue in the EOP, with women of color facing the largest disparities among all demographic groups. Despite some periods of improvement over the past 20 years, these gains have been inconsistent and often followed by periods of regression. For instance, although women reached pay parity in 2022, this progress was short-lived, as the trend quickly reversed. People of color have also achieved parity in the years 2006, 2022, and 2023, but have struggled to maintain this progress during the other 17 years. Women of color have made even less progress towards pay equity, consistently earning less than 90 cents for every dollar earned by a White man in the EOP.
The pay gap for gender and racial minorities was at its widest during the first year of the Trump administration in 2017. During this year, women in the EOP earned only 63 cents for every dollar earned by White men, while people of color in the EOP earned 77 cents for each dollar earned by their White male counterparts. Meanwhile, women of color fared even worse, earning only 61 cents for every dollar earned by White men.
Need for Systemic Change
Our analysis reveals that, despite periods of progress in hiring and pay equity for women, people of color, and particularly women of color, these advancements have been inconsistent and, at times, regressive. A sharp decline in the hiring of diverse employees and political appointees between 2016 and 2020 demonstrates how shifts in political leadership can greatly affect diversity outcomes. Although there has been a noticeable rise in hiring diverse candidates post-2020, reflecting the current administration’s commitment to diversity goals, the data underscores that these equity gains remain fragile and reversible. Moreover, while there has been an increase in representation for women and people of color in the EOP, this has not yet translated into consistent pay equity.
Achieving hiring and pay equity in the Executive Office of the President remains a persistent issue that demands systemic policy reform. The following federal policies and executive orders would ensure that our government remains an inclusive workplace, regardless of changes in political leadership.
- Establish a Presidential Initiative to promote diversity, equity, and inclusion across the federal workforce, ensuring diversity in presidential appointments regardless of political shifts.
- Enact an Executive Order to Combat Sexual Assault and Harassment within the federal workplace, creating stronger protections and accountability measures.
- Support the Equity in Agency Planning Act (H.R.7881) to require federal agencies to embed equity into their operations, ensuring at least 20% of their goals focus on providing fair opportunities and improving transparency for systematically oppressed and excluded groups.
- Advance the Federal Government Equity Improvement Act (H.R.7882) to drive continuous equity improvements across government by establishing advisory teams, Equity Subcommittees, and enhancing data practices to promote fair outcomes for all communities.
Methodology
To create the figures, we first gathered data on the demographic characteristics and salaries of employees in the Executive Office of the President (EOP) from 2004 to 2024. Using the Annual Report to Congress on White House Office Personnel, we extracted key information such as each personnel’s name, employment status, salary, and position title. We then tracked demographic trends by calculating the percentage of employees who were women, people of color, and women of color for each year. To visualize salary disparities, we computed the median pay for each demographic category and compared it to the median salary of white men, which served as the baseline for our analysis.
The data used in this analysis came from a combination of official government reports and online public profiles. Specifically, we cross-referenced each employee’s name with LinkedIn and various biographies to collect demographic information such as gender identity and race. When direct demographic data was unavailable, we made use of secondary indicators like involvement in particular organizations, scholarships, and language proficiencies to infer a person’s background. In cases where no reliable personal data was found, we utilized statistics on first and last names to make reasonable estimates of gender and race/ethnicity.
We applied a coding system to standardize the demographic categories for our analysis. For gender identity, we coded each employee as “Woman,” “Man,” or “Other,” though no EOP employee fell into the “Other” category during the time frame studied. For race and ethnicity, we used seven categories: American Indian or Alaska Native, Asian, Black or African American, Hispanic or Latinx, Middle Eastern or North African, Mixed, Native Hawaiian or Other Pacific Islander, and White. All non-White employees were categorized as people of color. By systematically coding the data, we were able to analyze salary and representation trends across these demographic groups over the two-decade period.
Project Credits
Data Collection: Siri Hollowitch, Savannah Lavigne, Adam Lindner, Tori Simmons, Royce Wasik
Writing: Grace Getachew, Siri Hollowitch, Yuki Li
Analysis & Data Visualization: Siri Hollowitch
Web Design: Daniel Torres Balauro